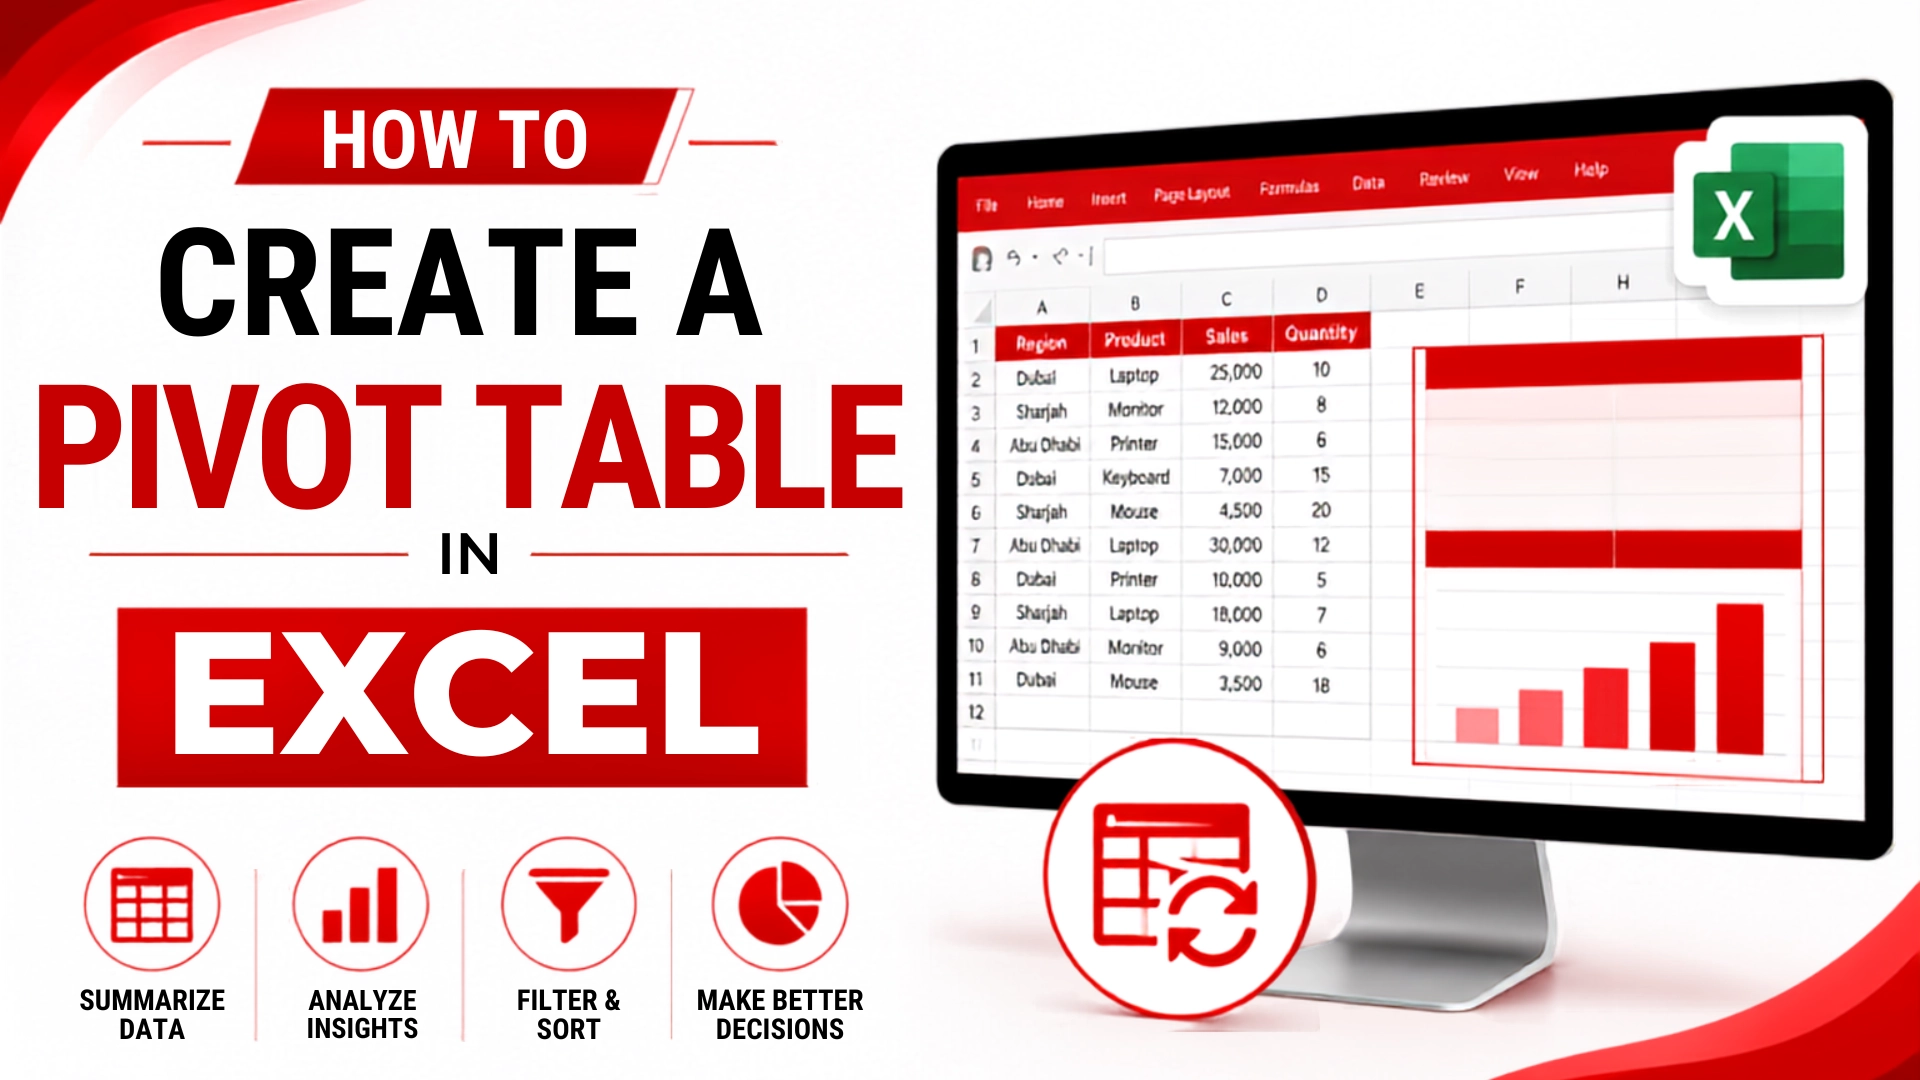
A Pivot Table is a sophisticated tool for calculating, summarizing, and analyzing data that allows you to spot similarities, patterns, and trends. PivotTables behave differently depending on the platform on which you run Excel. Pivot tables are extremely handy when dealing with big volumes of data that would take too long to calculate manually. A pivot table may detect sums, averages, ranges, and outliers, among other data processing capabilities. The table then presents this data in a simple, comprehensible structure that highlights essential values.
Chipin will guide you to create PivotTables follow the steps of the video to know how to create it
Select the cells you want to create a Pivot Table from.
Select Insert > Pivot Table.
This will create a Pivot Table based on an existing table or range.
Choose where you want the PivotTable report to be placed. Select New Worksheet to place the PivotTable in a new worksheet or Existing Worksheet and select where you want the new PivotTable to appear.
Click OK
Get a Free IT Consultation
Your goals. Our expertise. Perfect solutions.
Cybersecurity & EDR Solutions
Cloud & Microsoft 365 Migration
IT AMC & Managed Support
Office IT Setup & Relocation
17+
Years in Dubai
999+
Clients Served
4.9
Google Rating
SPEAK WITH AN EXPERT
Fill in your details
Your information is secure. We reply within 2 hours.